 Web Server Statistics for sadangfm.com
Program started on Sat, Dec 21 2019 at 8:48 PM.
Analyzed requests from Thu, Jan 24 2019 at 11:59 AM to Sat, Dec 21 2019 at 4:16 PM (331.18 days).
Web Server Statistics for sadangfm.comProgram started on Sat, Dec 21 2019 at 8:48 PM.
Analyzed requests from Thu, Jan 24 2019 at 11:59 AM to Sat, Dec 21 2019 at 4:16 PM (331.18 days).
(Go To: Top | General Summary | Monthly Report | Daily Summary | Hourly Summary | Domain Report | Organization Report | Status Code Report | File Size Report | File Type Report | Directory Report | Request Report)
Figures in parentheses refer to the 7-day period ending Dec 21 2019 at 8:48 PM.
Successful requests: 19 (4)
Distinct files requested: 8 (4)
Distinct hosts served: 8 (1)
Data transferred: 13.97 megabytes (4.40 megabytes)
Average data transferred per day: 43.19 kilobytes (644.32 kilobytes)
(Go To: Top | General Summary | Monthly Report | Daily Summary | Hourly Summary | Domain Report | Organization Report | Status Code Report | File Size Report | File Type Report | Directory Report | Request Report)
Each unit ( ) represents 1 request for a page.
| month | #reqs | #pages | |
|---|---|---|---|
| Jan 2019 | 4 | 0 | |
| Feb 2019 | 0 | 0 | |
| Mar 2019 | 11 | 0 | |
| Apr 2019 | 0 | 0 | |
| May 2019 | 0 | 0 | |
| Jun 2019 | 0 | 0 | |
| Jul 2019 | 0 | 0 | |
| Aug 2019 | 0 | 0 | |
| Sep 2019 | 0 | 0 | |
| Oct 2019 | 0 | 0 | |
| Nov 2019 | 0 | 0 | |
| Dec 2019 | 4 | 0 |
Busiest month: Jan 2019 (0 requests for pages).
(Go To: Top | General Summary | Monthly Report | Daily Summary | Hourly Summary | Domain Report | Organization Report | Status Code Report | File Size Report | File Type Report | Directory Report | Request Report)
Each unit () represents 1 request for a page.
| day | #reqs | #pages | |
|---|---|---|---|
| Sun | 0 | 0 | |
| Mon | 0 | 0 | |
| Tue | 0 | 0 | |
| Wed | 0 | 0 | |
| Thu | 4 | 0 | |
| Fri | 1 | 0 | |
| Sat | 14 | 0 |
(Go To: Top | General Summary | Monthly Report | Daily Summary | Hourly Summary | Domain Report | Organization Report | Status Code Report | File Size Report | File Type Report | Directory Report | Request Report)
Each unit () represents 1 request for a page.
| hour | #reqs | #pages | |
|---|---|---|---|
| 0 | 0 | 0 | |
| 1 | 2 | 0 | |
| 2 | 7 | 0 | |
| 3 | 1 | 0 | |
| 4 | 0 | 0 | |
| 5 | 0 | 0 | |
| 6 | 0 | 0 | |
| 7 | 0 | 0 | |
| 8 | 0 | 0 | |
| 9 | 0 | 0 | |
| 10 | 0 | 0 | |
| 11 | 2 | 0 | |
| 12 | 2 | 0 | |
| 13 | 0 | 0 | |
| 14 | 0 | 0 | |
| 15 | 0 | 0 | |
| 16 | 4 | 0 | |
| 17 | 0 | 0 | |
| 18 | 0 | 0 | |
| 19 | 0 | 0 | |
| 20 | 0 | 0 | |
| 21 | 0 | 0 | |
| 22 | 0 | 0 | |
| 23 | 1 | 0 |
(Go To: Top | General Summary | Monthly Report | Daily Summary | Hourly Summary | Domain Report | Organization Report | Status Code Report | File Size Report | File Type Report | Directory Report | Request Report)
Listing domains, sorted by the amount of traffic.
| #reqs | %bytes | domain |
|---|---|---|
| 19 | 100% | [unresolved numerical addresses] |
(Go To: Top | General Summary | Monthly Report | Daily Summary | Hourly Summary | Domain Report | Organization Report | Status Code Report | File Size Report | File Type Report | Directory Report | Request Report)
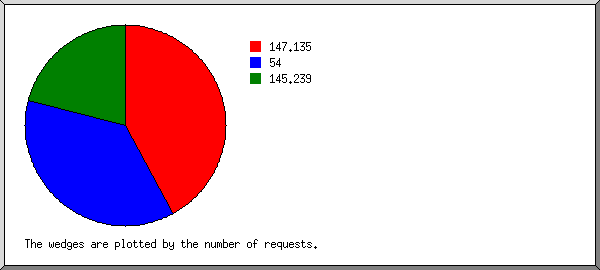
Listing organizations, sorted by the number of requests.
| #reqs | %bytes | organization |
|---|---|---|
| 8 | 63.07% | 147.135 |
| 7 | 36.39% | 54 |
| 4 | 0.54% | 145.239 |
(Go To: Top | General Summary | Monthly Report | Daily Summary | Hourly Summary | Domain Report | Organization Report | Status Code Report | File Size Report | File Type Report | Directory Report | Request Report)
Listing status codes, sorted numerically.
| #reqs | status code |
|---|---|
| 19 | 200 OK |
(Go To: Top | General Summary | Monthly Report | Daily Summary | Hourly Summary | Domain Report | Organization Report | Status Code Report | File Size Report | File Type Report | Directory Report | Request Report)
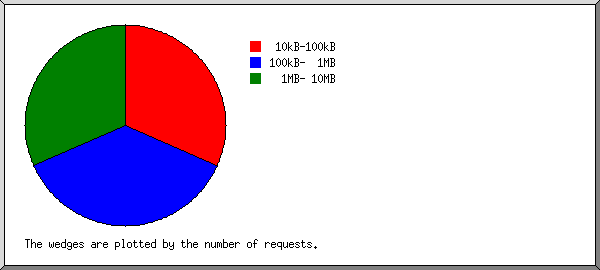
| size | #reqs | %bytes |
|---|---|---|
| 0 | 0 | |
| 1B- 10B | 0 | |
| 11B- 100B | 0 | |
| 101B- 1kB | 0 | |
| 1kB- 10kB | 0 | |
| 10kB-100kB | 6 | 0.79% |
| 100kB- 1MB | 7 | 26.05% |
| 1MB- 10MB | 6 | 73.16% |
(Go To: Top | General Summary | Monthly Report | Daily Summary | Hourly Summary | Domain Report | Organization Report | Status Code Report | File Size Report | File Type Report | Directory Report | Request Report)

Listing extensions with at least 0.1% of the traffic, sorted by the amount of traffic.
| #reqs | %bytes | extension |
|---|---|---|
| 18 | 95.39% | .jpg [JPEG graphics] |
| 1 | 4.61% | .png [PNG graphics] |
(Go To: Top | General Summary | Monthly Report | Daily Summary | Hourly Summary | Domain Report | Organization Report | Status Code Report | File Size Report | File Type Report | Directory Report | Request Report)
Listing directories with at least 0.01% of the traffic, sorted by the amount of traffic.
| #reqs | %bytes | directory |
|---|---|---|
| 19 | 100% | /wp-content/ |
(Go To: Top | General Summary | Monthly Report | Daily Summary | Hourly Summary | Domain Report | Organization Report | Status Code Report | File Size Report | File Type Report | Directory Report | Request Report)
Listing files with at least 20 requests, sorted by the number of requests.
| #reqs | %bytes | last time | file |
|---|---|---|---|
| 19 | 100% | Dec/21/19 4:16 PM | [not listed: 8 files] |